Climatic Data “Data Davis” Meteorological Station – Bioclimatic Buildings Laboratory
The group of Bioclimatic Buildings of INENCO has a Data Davis Vantage Pro2 Meteorological Station that measures temperature, relative humidity, atmospheric pressure, wind speed, wind direction, global solar radiation on a horizontal plane, UV index, among other variables, at intervals of 15 adjustable minutes. As a summary, the data of temperature, humidity, and solar radiation were grouped into the following tables as Maximum monthly average daily temperature, minimum monthly average daily temperature, absolute maximum, absolute minimum, monthly average temperature, monthly average relative humidity, and irradiance global daily average monthly on the horizontal surface.
| SUMMARY OF ANNUAL DATA | |||||
|---|---|---|---|---|---|
| 2014 | 2015 | 2016 | 2017 | 2018 | 2019 |
| 2020 | |||||
Below you can download the files with the climatic data per month:
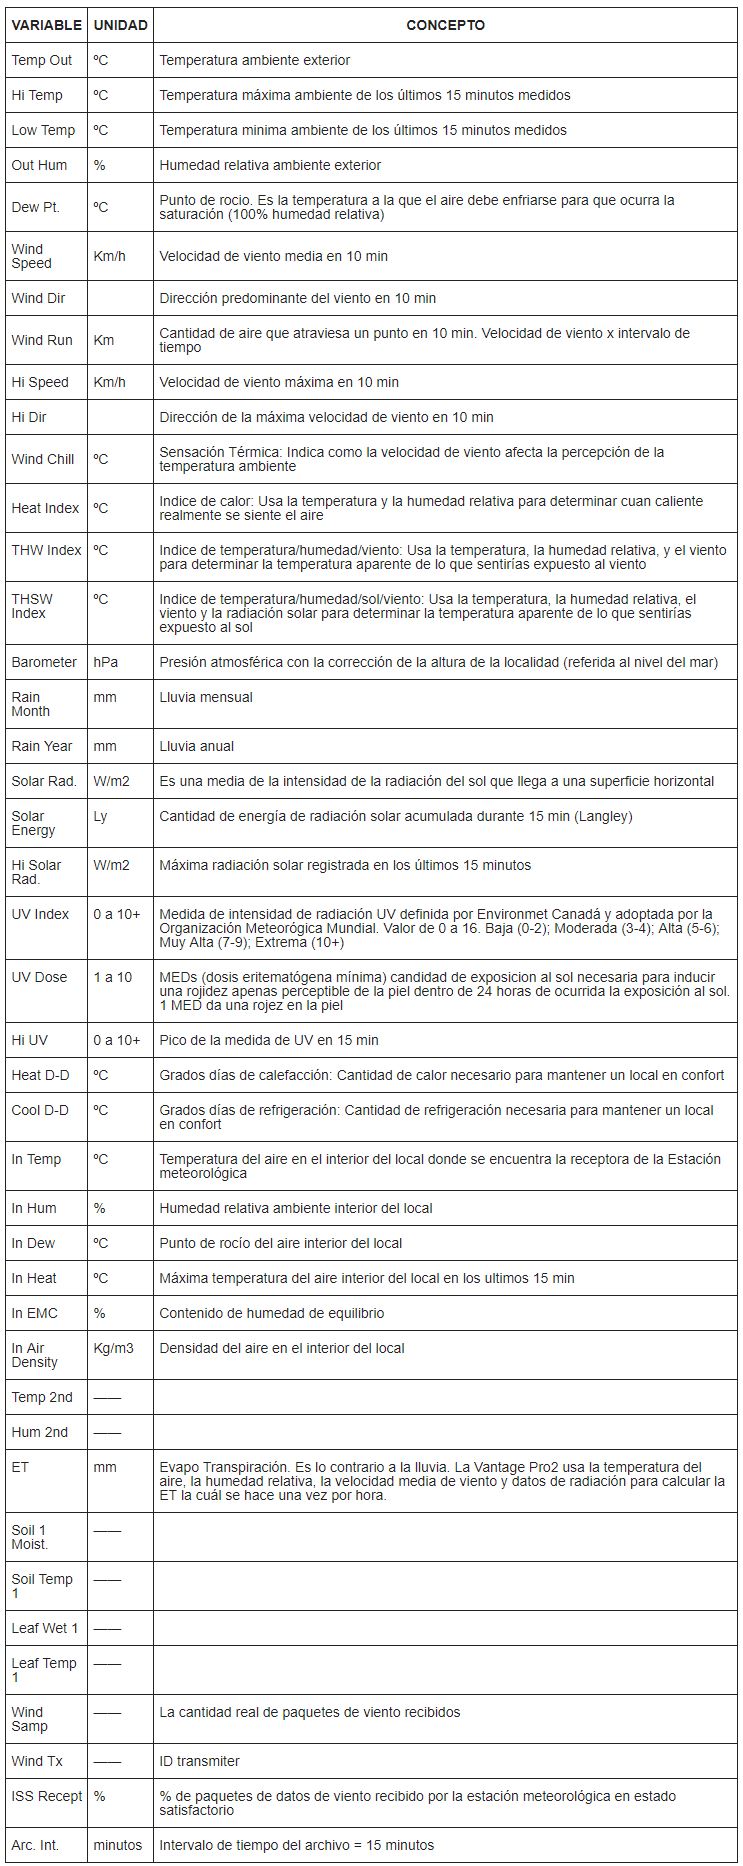
 The variables present in the document to download are the following:
